Key takeaways for you – Why infographics are important?
| – Infographics are super powerful tools for communicating complex info in a visually appealing and digestible way. From timeline to comparison infographics, they can transform any dull topic into a captivating one. – You might be wondering how infographics and SEO go hand in hand. Well, a well-crafted infographic can make link-building easier, increase brand awareness, drive more traffic to your site, and help you rank higher in image searches. Plus, it adds relevancy to your content, making it evergreen. – Now, creating infographics doesn’t require a degree in graphic design. With tools like Canva and Piktochart, you can get your hands dirty in no time. Just remember to keep it unique, short, and creative, and don’t forget to add that share button. – But what’s the use of a great infographic if it doesn’t reach your audience, right? So, do some keyword research, use the keyword as your file name, add “infographic” in your header tag, and don’t forget to optimize your URL. These tricks will make your infographic SEO-friendly. – To sum it up, infographics are like the billboards of the internet world. They can bring in more traffic, earn you backlinks, and spread brand awareness. So, don’t wait any longer. Start creating and see your SEO game level up. |
Imagine ourselves in a bustling city.
Picture a crowded street with people hurrying past billboards and signs vying for their attention.
In this bustling environment, only the most eye-catching and captivating displays manage to capture the interest of passersby, leaving a lasting impression.
Like these captivating billboards, infographics provide a visual break from the textual overload prevalent on the web.
They transform complex information into visually appealing and easily digestible pieces of content that are more likely to capture attention and engage viewers.
That’s the reason why infographics are important and have gained popularity on the internet.
Want to know more about how they can help your SEO goals and how to create them?
Hop in!
What are infographics?
Well, what exactly are infographics?
Simply put, it visually represents information through a chart or diagram. Or in other words, it is a mix of information and graphics.
The best part about using infographics is that it turns a dull topic into a spellbinding experience.
Using infographics, you can present your content in an easily digestible way that your audience can absorb at a glance.
They are a form of visual communication created to grab your audience’s attention while engaging them in complex and factual content.
There are different types of infographics:
- Timeline infographics
- Informational infographics
- Map infographics
- List infographics
- Data visualization infographics
- Comparison infographics
You choose from them as per your need.
Besides enhancing user experience, infographics can help you stay ahead in your SEO game.
Let’s check how!
How do infographics help SEO?
As I said before, infographics can totally change your SEO game, and here’s how that can happen:
Makes link-building easier
As per Search Engine Journal, mindblowing content, and link-building are the best SEO strategies to help your website rank higher on the SERPs.
With infographics, link-building becomes much easier.
How?
When you create a visually stunning infographic with valuable information and data, people will share it on their website, and the best part is you don’t even need to beg them.
You can add an embed code to your site, making it easier for people to use it in their own content while linking back to the original source.
Isn’t it a great idea!
It helps spread brand awareness
Infographics are the best tools to spread your brand awareness. You can use this, to impart important information about your brand, product, or services.
These precisely created visual treats can be powerful communication tools to describe your brand. They just don’t tell people your brand story but show it to them visually.
Along with spreading brand awareness, they drive traffic to your site.
Yes, a well-crafted infographic targeting a specific audience can drive traffic to your site.
If you create relevant, informative, valuable infographics with excellent visual appeal, it is likely that they will grab the attention.
Helps rank higher in the image search
Another benefit of infographics is that they help your site rank higher in the image search. Image search is one of the SERP features and a Google search channel.
So if you create an infographic that explains and clarifies complex processes or topics, you will get some extra clicks and traffic.
Increases relevancy
When you create an interesting infographic, it can circulate for many years. Some topics are evergreen, and they always interest not only your target audience but also the industry and general public.
So try to address topics from unique angles, and they will sustain the test of time long after your content is published.
I am sure you have now understood how infographics can change your SEO game.
Now, let’s move forward and learn some tips to design your own infographics.
How to design your own infographics?
If you are new to infographics, you must wonder how to create awesome infographics for your site or business.
You will be happy to know that you won’t need an expert to do that, as there are many free and paid tools available in the market that will help you do it easily.
Some of these tools are:
- Canva
- Easelly
- Piktochart
- Snappa
- Infogram
- Adobe Express
Whichever tool you use, keep these points in mind:
Make it unique
It is essential to make it unique to stand out in the crowd. A unique design that explains everything clearly will attract your audience’s attention.
Make it short and precise
Believe me, your audience can get information from any corner of the internet. They will come to your site only to find digestible information.
So don’t overwhelm them with information. Also, using too many images, colors, and designs may confuse your audience.
So make it simple for them with minimal use of words.
Be creative and bold.
Whatever your message is, you need to keep it bold and innovative.

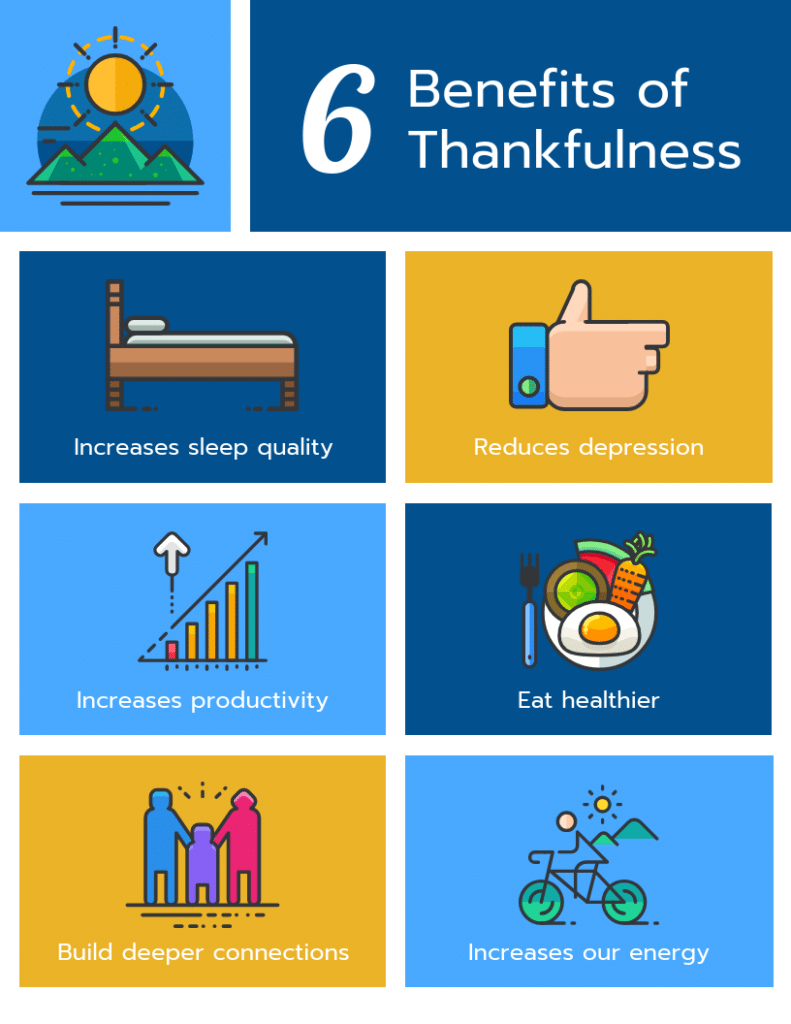
Look at this infographic. There are very few words. But the creator has conveyed his message by using images and shapes effectively.
Add the share button.
Of course, you need to share your message through the infographic you have created, and to do so you need to add a share button.
This will help people share the infographics across social media platforms spreading your message.
I am sure you have now got the hang of creating infographics, and you just need to know how to make the search bot and viewers aware of its presence.
Let me help you understand that.
How to optimize your infographics for search?
Here’s how you should optimize your infographics for search:
Start with keyword research
This is the most important part because irrespective of the type of content when you need to SEO optimize it, keyword research is always the starting point.
If you already have the content ready, then you will also have the list of keywords that you have used. If you start from scratch, you must conduct keyword research first.
Use the primary keyword as the file name.
Don’t name the file “infographic_1.jpg”.
Instead, use the primary keyword as the file name.
“What-are-the-benefits-of-blackseed-oil.jpg” is a much better file name. Mainly because Google can’t read the actual content of your infographics, but it can read your file name.
Add the word infographic to the header tag
You can use the term “infographic” in your header tag to let people know that your content contains an infographic.
Add alt text
Adding alt text is another way to let search engines know what your content is all about. If an image fails to load, people will see the alt text you added in the alt tags.
To know more about alt text, check out my blog on the same.
Mention it in the meta description
Your prime focus should be to keep the meta description within 150-160 words. Use your creativity and Try to add the term “infographics” along with the primary keyword in it.
Optimize your URL
If the infographic is the focus of your content, add the word “infographic” along with the primary keyword in your URL.
But try to do it without compromising the URL length. Also, it doesn’t mean you must mention it every time you have an infographic.
Ready to up your SEO Game 1 notch higher with infographics?
Now think about getting backlinks without bagging them simply by creating these wonderful easy-to-digest marvels.
You are earning backlinks and spreading awareness about your brand, product, or services.
You don’t need to think twice before creating infographics with the tips and tools I have mentioned in this post.
So don’t just wait; create your own infographics today and master the SEO game.
FAQs
What are the three important elements of infographics?
The three important elements of an infographic are:
1. The story that you want to tell through your infographics.
2. A copy of an infographic is super important. Write an attention-grabbing headline. Keep it simple. The rest of the points need to be precise and to the point.
3. Design is another element that is paramount to it. The design includes the color, font, and layout. It should not be overwhelming.
What are the main features of an infographic?
These are the main features of an infographic:
1. An exciting and clearly organized storyline
2. Descriptive title and subheadings
3. Bold but thematically appropriate color scheme
Insightful data
4. Attention-grabbing graphics


